Creating a GUI visualisation
Creating Custom Visualisations of Signals
The Bela IDE now integrates with p5.js, a library specially designed for creating visual interfaces and interactive elements. You can send data from your Pure Data patch to be visualised using the p5.js GUI and you can also send control messages from your GUI to control the patch running on the board. In this example we will look at both cases.
Table of contents
Creative coding for visuals
The Processing foundation have been responsible for a revolution in the way that coding is taught. By placing the emphasis on creative interactive tasks, simple understandable coding concepts and great educational materials Processing (the standalone version of p5.js) has become widely adopted in universities and art colleges around the world and is responsible for introducing a whole generation of makers to coding.
At Bela we are a big fan of Processing and p5.js and have been keen to integrate it with our IDE for a long time. This dream has been realised and you can now create custom GUIs that interact with the code you have running on your Bela. To launch the GUI there is now a dedicated button in the IDE which will open your creation in another tab.
What is p5.js?
p5.js is a JavaScript library for creating visuals in the browser. Because Bela’s IDE is native to the browser, p5 was an obvious choice. p5 also has the advantage of being very similar to Processing. Processing is an application for creating interactive visual applications that is very popular among artists, designers and educators. Since Bela is geared towards people who make creative things with technology, it means that people were likely to have some familiarity with p5 concepts already.
The structure of a project with a GUI
In addition to your Pure Data patches you will see that this project has a file which is called sketch.js which is your GUI file written in p5.js. In this tutorial and the next we are going to concentrate on how you can send and receive data from the GUI in Pure Data rather than looking in detail at how you write the javascript code which makes up the sketch.js file. If you would like to delve deeper into that check out our page on Crafting GUIs in the IDE and it is also worth looking at the brilliant resources on the p5.js website.
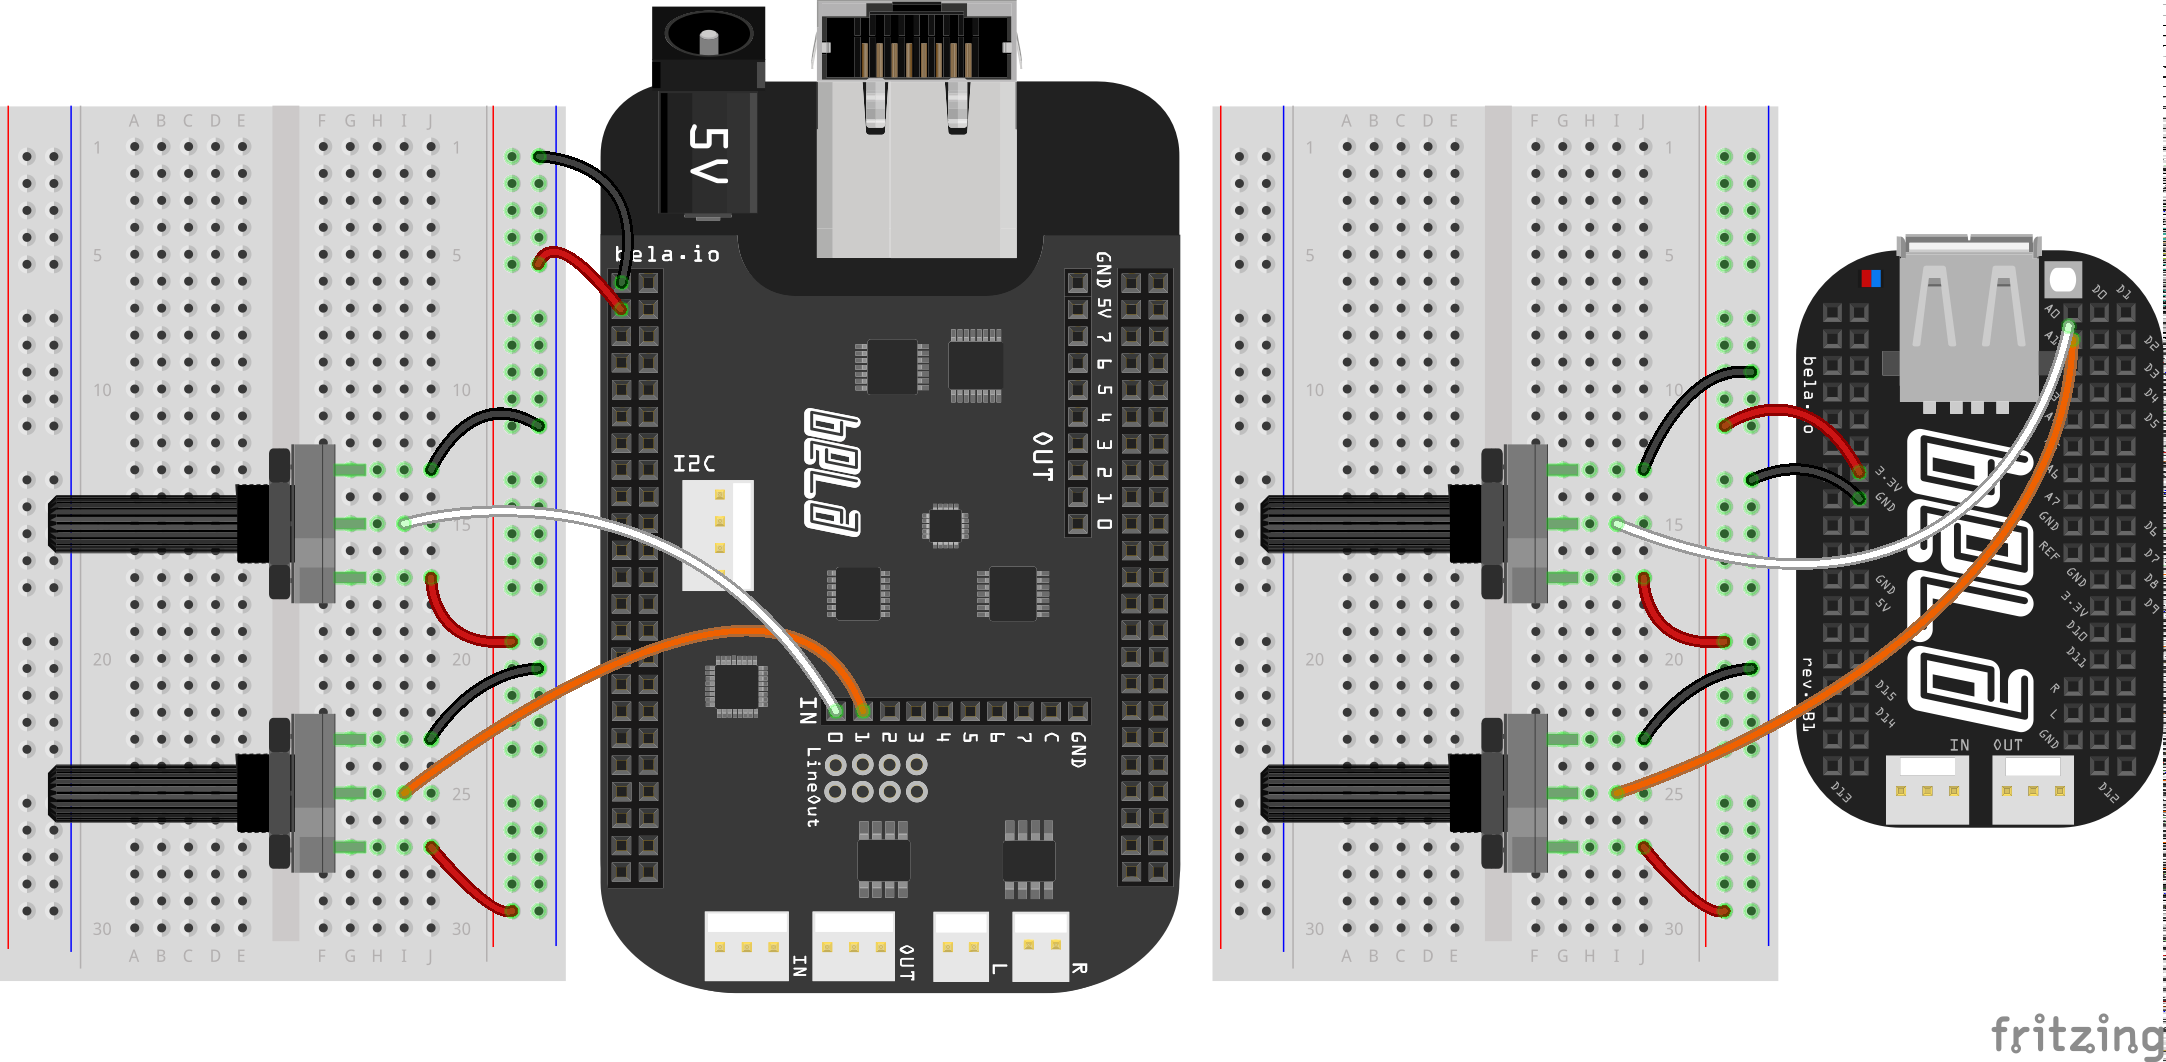
Hardware setup
For this example we just want two analog sensors connected the first two analog inputs of Bela. Two potentiometers will do the job nicely.
The code
Find the gui-send sketch in the Pure Data section of the Examples tab of the Bela IDE.
1. Sending signals to the GUI
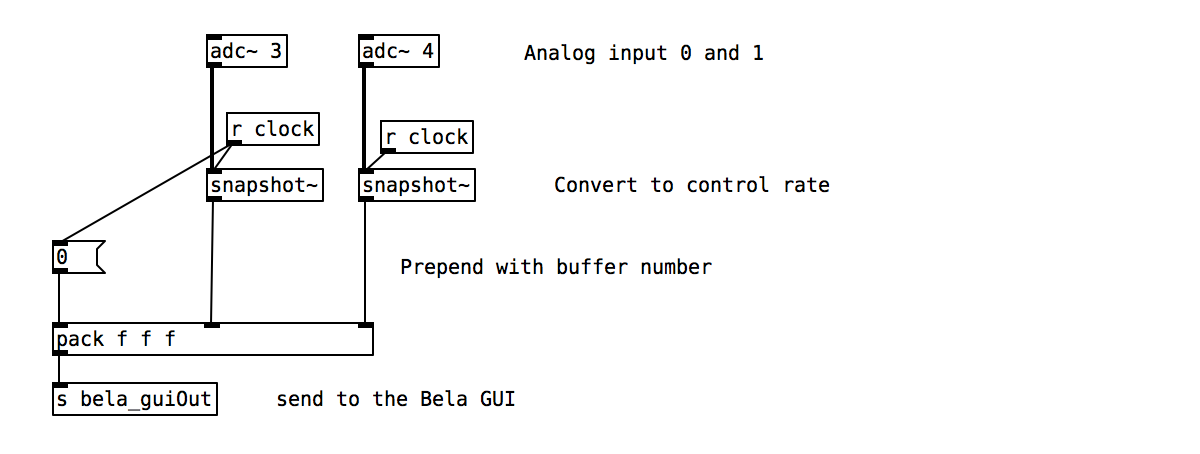
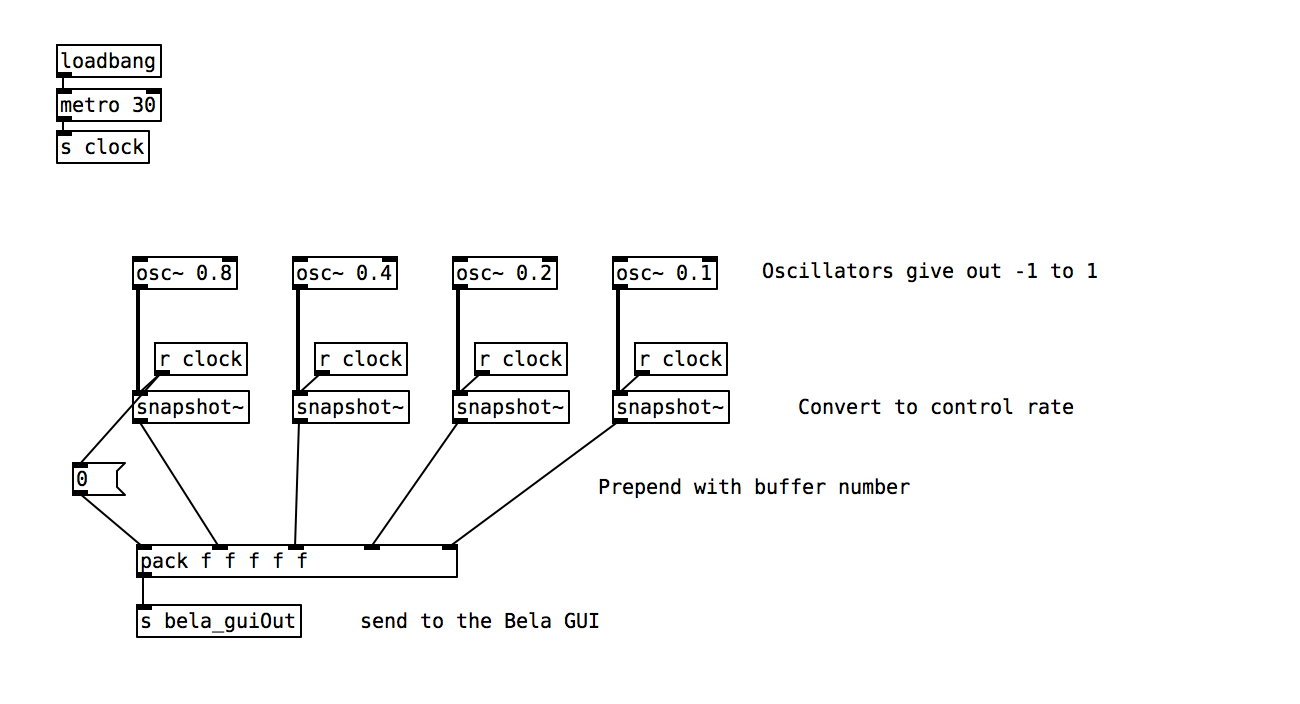
To send data to the GUI it is necessary to send a control rate signal to [s bela_guiOut].
2. A quick look at the p5.js code
We receive the data that is sent from the Pure Data patch in sketch.js file with Bela.data.buffers[0] which will return the buffer we sent. We use this to change the rendering of four circles.
Practice tasks
Task 1: Use the potentiometers to change the size of the ellipse
Currently we are sending 4 low frequency oscillators to the gui. Alter your patch so that you are sending the first two analog inputs to the p5 sketch.
function setup() {
    createCanvas(windowWidth, windowHeight);
}

function draw () {

    // Draw a black background with opacity
    background(0, 50);

    // Retreive the data being sent from render.cpp
    let inputs = Bela.data.buffers[0];

    // Calculate position for drawing the circle
    let circlePosition = windowWidth/3;

    noFill();
    stroke(255);

    // Strings for the input name
    let s = 'Analog input ';
    let c = ':';

    for (var i = 0; i < 2; i++) {

        // Write the name of the analog input and its value
        textSize(32);
        textAlign(RIGHT);
        text(s+i+c, circlePosition + (circlePosition*i), 50);
        text(round(inputs[i], 2), circlePosition + (circlePosition*i)+100, 50);

        // Draw circles which change in size with the analog inputs
        const size = 200 * inputs[i];
        ellipse(circlePosition + (circlePosition*i), windowHeight / 2, size, size);
    }
}